


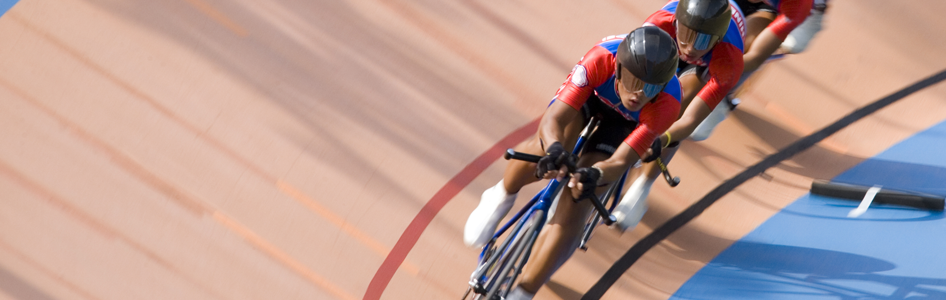
Track cycling is a specific discipline including different events, individual or team. The events take place on an indoor velodrome. The track is specific and has 2 turns up to about 40 degrees. The floor is often made of wood. The minimum length of an Olympic velodrome is 250 meters, but the tracks can measure 200 or 333 meters.
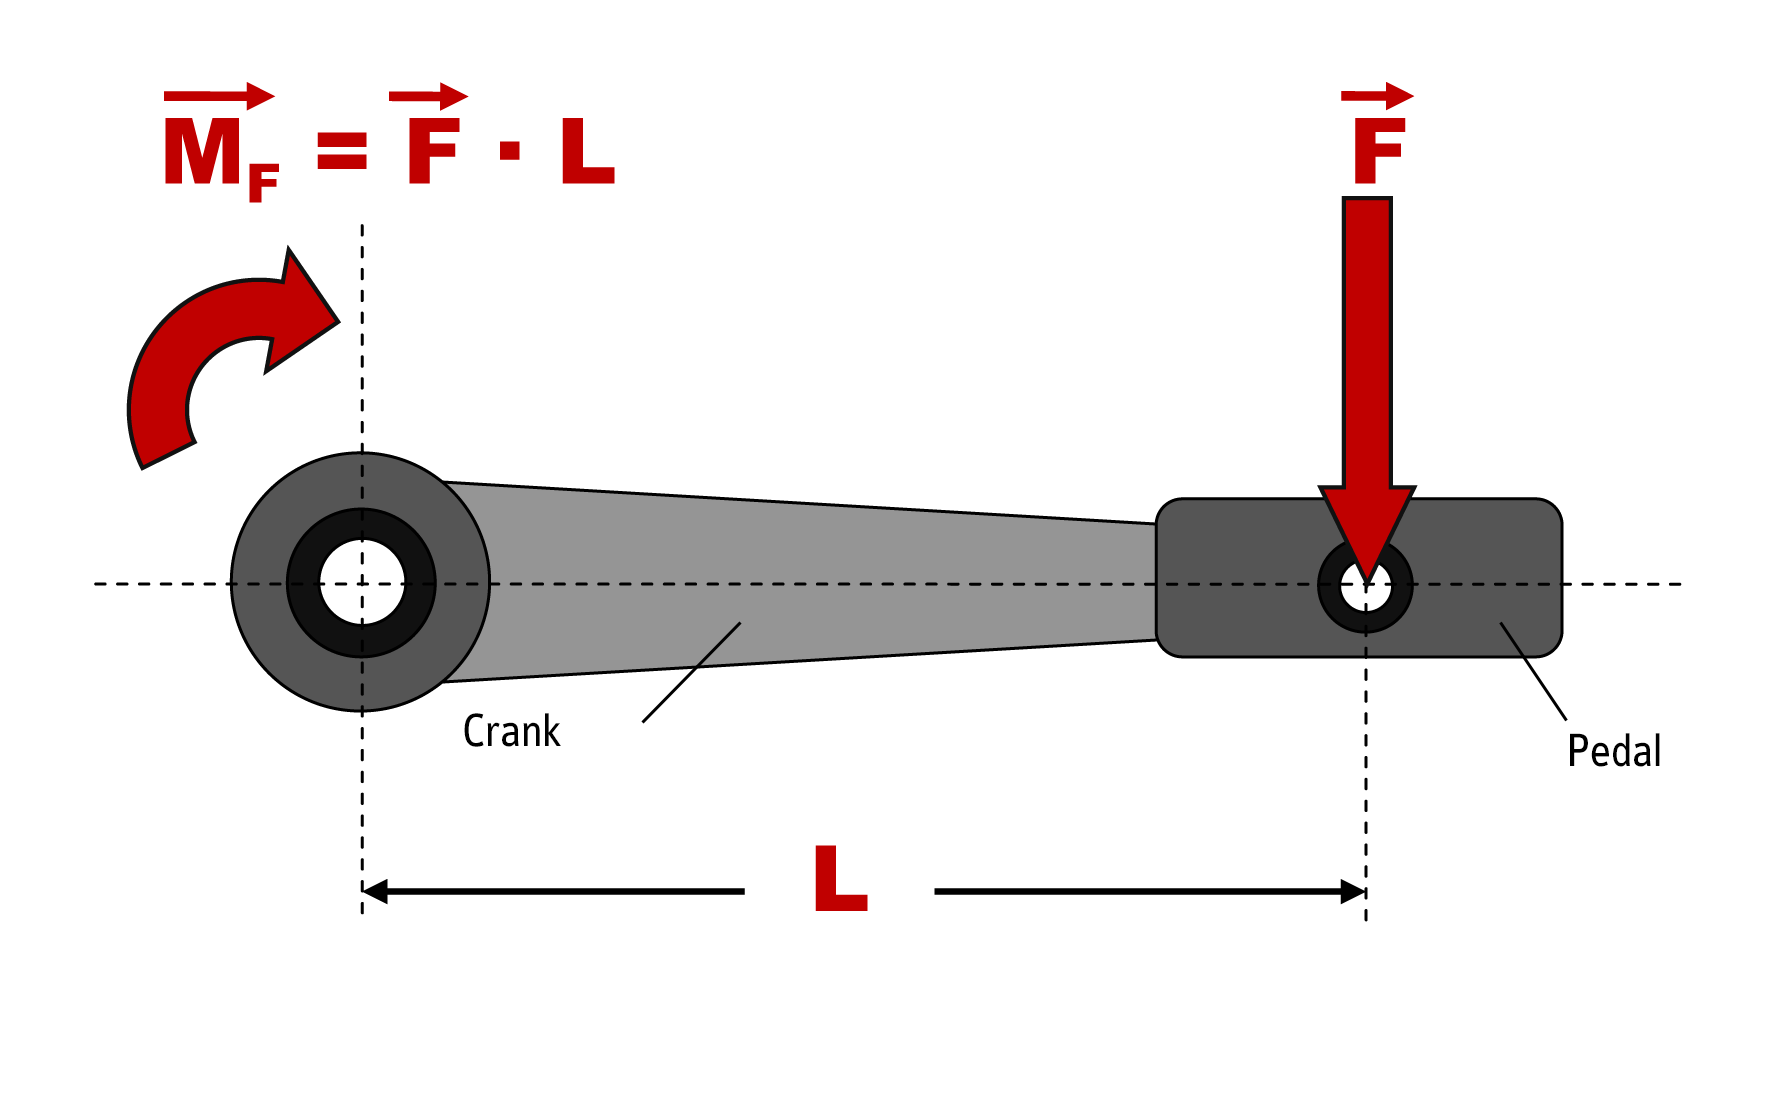
Figure 1. Torque or moment of force applied to the axis of... (Click to enlarge)
The "Flying 200m Time Trial" is an individual event used for qualification in individual speed events. Cyclists must reach a maximum speed before to cover the last 200 meters. Only the last 200 meters are timed, and the time achieved is used for qualification. Three main phases characterize this event: the acceleration before the 200m portion, the maximum speed phase and the deceleration phase (The last two phases are in the 200m portion). The best times are generally between 10 and 11 seconds, with travel speeds above 65 km/h. The world record is held by the Frenchman François Pervis in 9.347 s, a speed of 77 km/h.
In track cycling, this event can be described as explosive. Indeed, the force, the speed, and the mechanical power produced (P, in W) are determining factors of the performance. Since the pedaling system is fixed gear, the gear chosen before the race will influence the cadence (ie, the frequency) of the average pedaling over the 200 m (Cadmean, in rpm) but also the mechanical torque (C, in N·m). Torque is the product of the force applied to turn the crank and the length of the crank (Fig. 1).
In addition, as explained in the article on projected frontal area in cycling, aerodynamic resistance is the main resistance to cyclist motion when speeds are greater than 40 km/h. This resistance is mainly dependent on the aerodynamic drag coefficient (CX) and the projected frontal area of the cyclist and his bicycle (AP, in m2) (Fig. 2). AP is mainly dependent on the position of cyclists, their anthropometric parameters and their equipment.
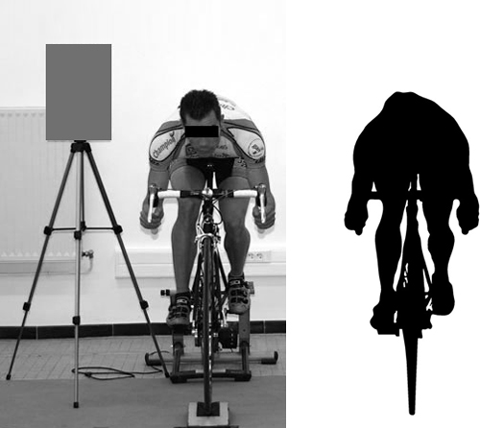
Figure 2. Projected frontal area of a cyclist (in black) in aerodynamic position.
In 2005, a team of French researchers tried to understand if these mechanical and anthropometric parameters were related to the performance on the Flying 200m Time Trial. For this protocol, 12 international cyclists, including 3 world or Olympic champions, participated in the study one month before the start of the national track cycling championships. The study took place in 3 steps :
The percentage of body fat (BF, in %) was determined using the 4 skin fold method. The lean mass volume of the thighs (VThigh, in L) was determined by an indirect technique based on the anthropometric characteristics of the thigh. And the projected frontal area of cyclists and their bicycle (AP, in m2) was determined using the digitization method (Fig. 2) (method detailed here).
On a Monark cyclo ergometer, after approximately 5 minutes of warm-up, the cyclists made 3 sprints against 3 different resistances according to their body mass (0.3, 0.6 and 0.9 N/kg). Each sprint lasted about 5 seconds. From these tests, the torque - cadence (Fig. 3) and power-cadence ratios (Fig. 4) were determined for each cyclist. Through these relationships, the following variables have been measured :

Figure 3. Torque-Cadence relationship... (Cliquez sur l'image pour l'agrandir)

Figure 4. Power-Cadence relationship... (Cliquez sur l'image pour l'agrandir)
During the National Track Cycling Championships, performances of the Flying 200m Time Trial were considered for this study. From the chronometric performances, the following mechanical parameters were deduced : the average speed on the 200 m (vmean, in m/s) and the average cadence on the 200 m (Cadmean, in rpm).
From these tests, statistical analyzes were used to determine the relationships between the anthropometric parameters, the mechanical parameters determined during laboratory tests on cyclo ergometer and the performances on the Flying 200m Time Trial.
The results show that there are significant correlations between :
The fact that the maximal power is correlated with the optimal torque and the theoretical maximal torque shows that the maximal force plays a very important role in this sport. This is reinforced by the significant correlation observed with the volume of lean mass of the thighs. Track cyclists have been following strength training for many years in addition to technical training, which may explain these results.
During a Flying 200m Time Trial, the mechanical power produced by the cyclist is used up to 90% to overcome the aerodynamic resistance. In this case, for a given mechanical power, minimizing the aerodynamic parameters, such as the projected frontal area for example, it is possible to increase the speed of displacement. This assumption is confirmed by the correlation between the average speed over the 200 m and the ratio of the maximum power to the projected frontal area of the cyclists.
The results also showed that the average pedaling cadence on the Flying 200m Time Trial was higher than the optimal cadence. This implies that the mechanical power produced at a mean cadence is lower than that produced at the optimal cadence (Fig. 4). It could be due to the choice of the gear before the race. It would be possible to increase it, but other factors come into play. Since the gear used in the Flying 200m Time Trial is usually used for the individual sprint event, tactical parameters must be considered.
It is interesting to see that many parameters affect track cycling performance. Speed events require explosive physical effort, but tactical criteria must also be considered. Minimizing the projected frontal area by keeping the bust closest to the bicycle and increasing the gear ratio could provide better performance. Nevertheless, since the acceleration phase is a determining phase during the events, the choice of the gear must be a compromise between the acceleration at the start and the average speed afterwards.
We remind you that you can quote articles by limiting your quotation to 200 words maximum and you must include a nominative link to this one. Any other use, especially copying in full on forum, website or any other content, is strictly prohibited. In doubt, contact us.
Copyright © 2011-2024 - www.sci-sport.com - All rights reserved

 Facebook
 Instagram
 Twitter
 Flux RSS
 Newsletter
 YouTube