


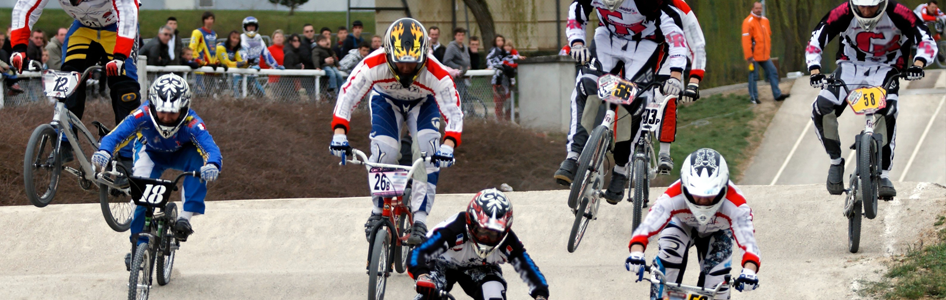
BMX racing was introduced at the Beijing 2008 Olympic Games. This sport takes place on a specific track whose length and geometry may vary (Fig. 1). In general, the length of the track varies from 300 to 400 m, and the departure always takes place at the top of a ramp whose slope is more or less inclined.
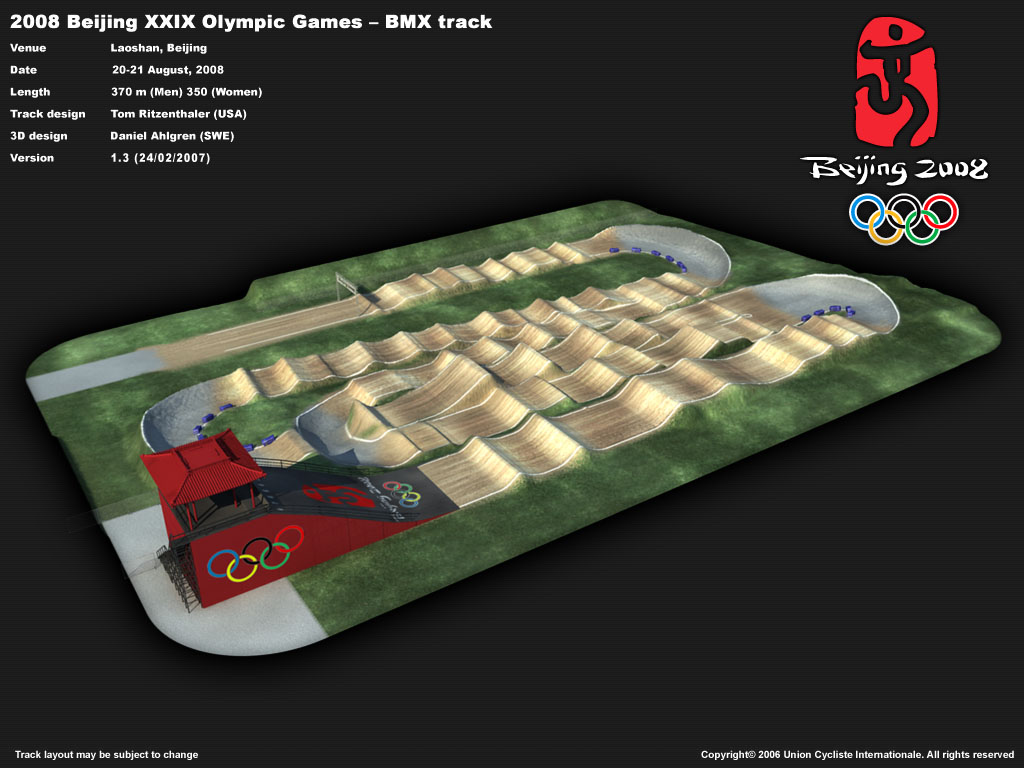
Figure 1. Track of the Beijing 2008 Olympic Games... (Cliquez sur l'image pour l'agrandir)
Eight riders compete in a race. The departure is made at the gate on the same line at the top of the starting ramp. The front wheel of the bike is supported on a metal grid. It is automatically lowered during the start signal. A lap is between 30 and 40 seconds, depending on the length of the track. The BMX competitions are held in successive rounds
The position of the riders at the end of the first straight line is decisive for the final rank of the race. Indeed, it is very difficult to pass an opponent then, and unless a fall, the ranking is almost final. Thus, the start is essential, the rider must be able to produce a very important mechanical power, as quickly as possible. Nevertheless, what criteria should a coach use to evaluate the performance of the riders in the starting straight line ? And what are the mechanical variables to improve ?
In 2007, in an attempt to answer these questions, a team of French researchers, of which I was a member, studied the relationship between different biomechanical variables during laboratory tests and the chronometric performance on the first straight line of a BMX track. The main objective was to identify performance factors but also to determine if laboratory tests could be useful in the rider level assessment. For this, 35 riders from regional to national level participated in this study. The experimental protocol consisted of 2 test sessions :
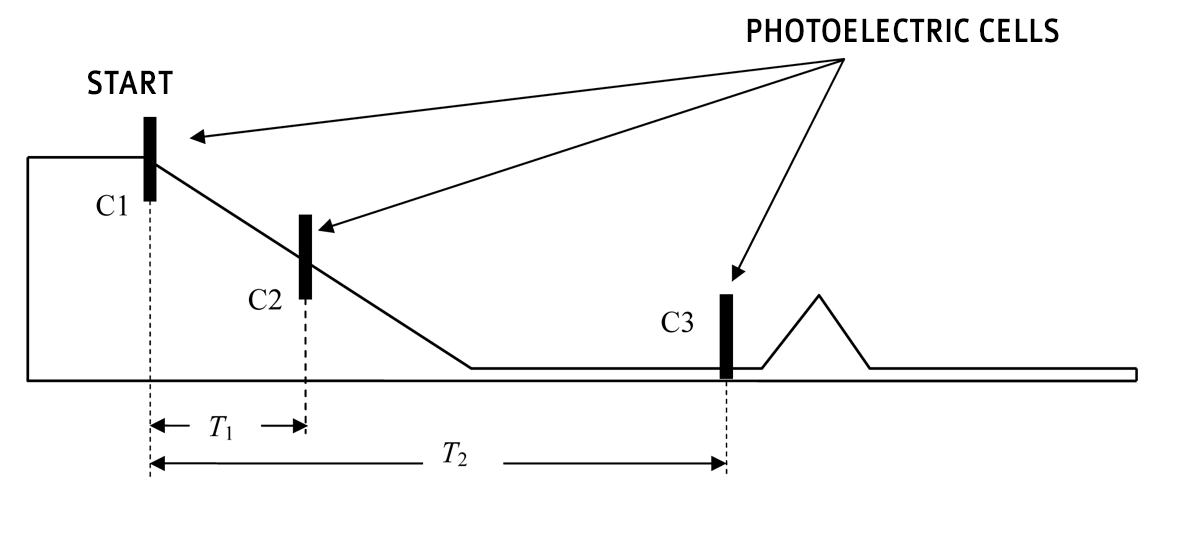
Figure 2. Placement of 3 photocells on the starting straight line of a BMX track. Cell C2 is placed about 5.2 m after the start gate, and cell C3 about 28.7 m from the start gate.
Concerning the laboratory tests, the power produced during jumps and sprints was expressed in absolute value but also in relative value to the body weight of the riders to better compare the riders with each other. To analyze these data, Bravais-Pearson correlations were made between biomechanical variables measured in laboratory tests and chronometric performance in T1 and T2.
The following significant correlations were observed between the mechanical variables studied during the laboratory tests and the chronometric performances. No significant correlation was observed between the maximal cadence and the chronometric performances :
In the field during this first straight line, the cadence rate is low which would solicit more force component than the speed component. This could explain that the cadence rate is not significantly correlated with the chronometric performance.
The strongest correlations are observed between the powers produced during jumps and sprints on cycle ergometer. These results show the link between the acceleration capacity during a start and the level of mechanical power production. This may partly explain the performance on the first straight line. In addition, the body weight of the riders does not seem to impede the chronometric performance, since the correlations were less strong with the power relative to the body mass. This can be explained by the fact that the start is on a downhill.
The results of this study showed that the cycle ergometer sprint tests and the vertical jumps were good indicators of performance on the first straight of a BMX track. They can be used as a means of detection or as a follow-up protocol during a season to evaluate gains from training, for example.
We remind you that you can quote articles by limiting your quotation to 200 words maximum and you must include a nominative link to this one. Any other use, especially copying in full on forum, website or any other content, is strictly prohibited. In doubt, contact us.
Copyright © 2011-2024 - www.sci-sport.com - All rights reserved

 Facebook
 Instagram
 Twitter
 Flux RSS
 Newsletter
 YouTube