


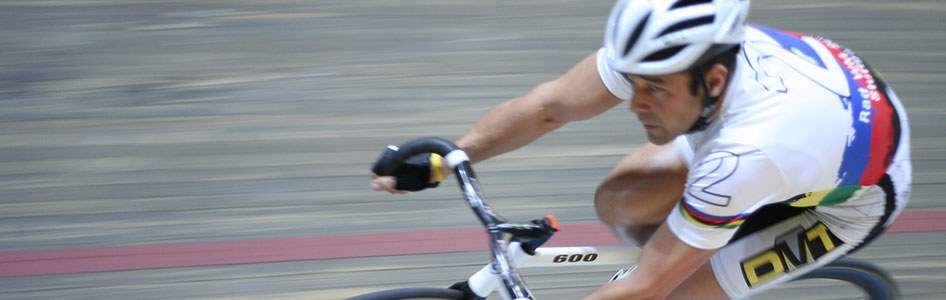
In cycling, several resistances are opposed to the motion : the resistance due to the gravity that occurs when the ground is inclined; the rolling resistance which represents the contact of the tires of the bicycle with the ground; and the aerodynamic drag that characterizes the air resistance to the moving system (the cyclist and his bicycle).
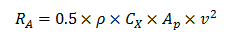
On level ground, at speeds greater than 40 km/h, the aerodynamic drag (RA, in Newton) represents approximately 90% of the total resistances opposed to motion. Which means that about 90% of the mechanical power produced by the cyclist is used to overcome this resistance. It is dependent on several variables, the air density (ρ, in kg/m3), the drag coefficient (CX, dimensionless), the projected frontal area of the cyclist and bicycle (Ap, in m2) and the square of the velocity relative to the fluid (v, in m/s) :
As you can see from this formula, the greater the cyclist's velocity, the higher the aerodynamic drag. The air density being dependent on atmospheric conditions (the barometric pressure, itself dependent on the altitude, the temperature and to a lesser extent the humidity) and the velocity having to be as great as possible, it remains therefore two modifiable parameters : CX and Ap.
CX represents the complexity of the general shape of the moving body in a fluid, the position of the cyclist and the movement of the air on the cyclist and his bicycle. It is not measurable directly, but different methods make it possible to estimate it.
Ap represents the projected frontal area of the moving body. Imagine that you are exactly in front of a cyclist on his bicycle in front of a white wall, the projected frontal area represents the whole visible area of this cyclist on his bicycle (Fig. 1 and Fig. 2). There are different techniques to directly estimate Ap. The advantage of quantifying it is that this value provides direct information on the aerodynamics of a position. To read more about this subject, consult our review on the subject.
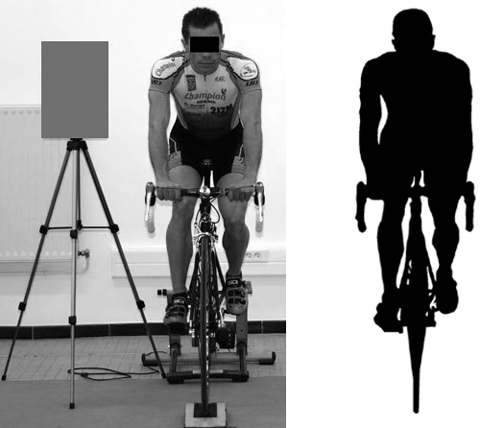
Figure 1. Projected frontal area of a cyclist (in black) in upright position.
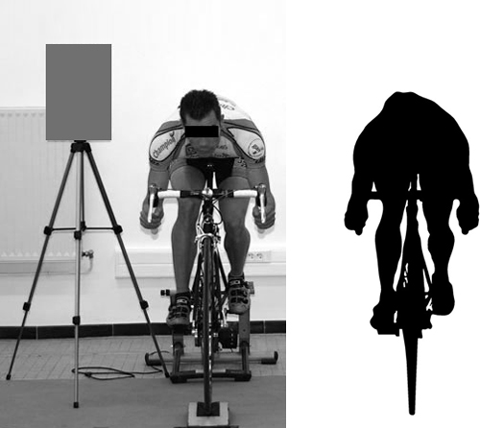
Figure 2. Projected frontal area of a cyclist (in black) in aerodynamic position.
In 2009, the team I was part of at the University of Reims Champagne-Ardenne was interested in the development of an assessing method of Ap in real conditions. What we found was that the existing methods allowed a good estimation of Ap, but always in laboratory condition, because these methods required the placement of a calibration area (reference area), the area of which was previously known (Fig. 1 and Fig. 2).
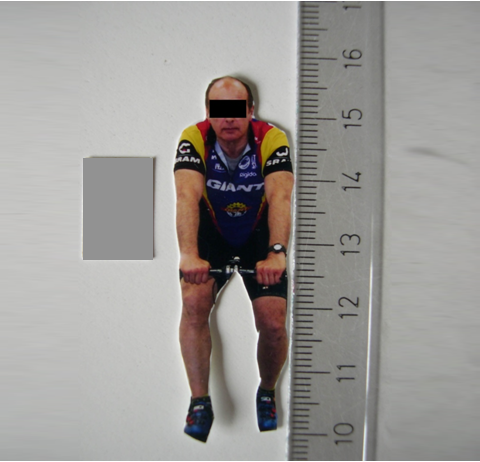
Figure 3. Illustration of the weighing photographs method.
Therefore, the study consisted in comparing the measurements obtained with our method and the measurements obtained by using the two most used methods in the literature: the "weighing photographs" method and the digitization method. We also checked the reproducibility of the different methods. The goal was to validate our method.
For this, the 9 cyclists who participated in the study placed themselves on their bicycle, which was itself placed on "Home Trainer", with their competition equipment. Each cyclist adopted two positions: a "upright" position (Fig. 1) and an "aerodynamic" position (Fig. 2). A calibration zone was placed at their side (Fig. 1 and Fig. 2, this is the gray rectangular area placed on a tripod). The area of this board was 0.110148 m2. A digital photograph of each position was taken.
According to each method, here is how the measurements were made:
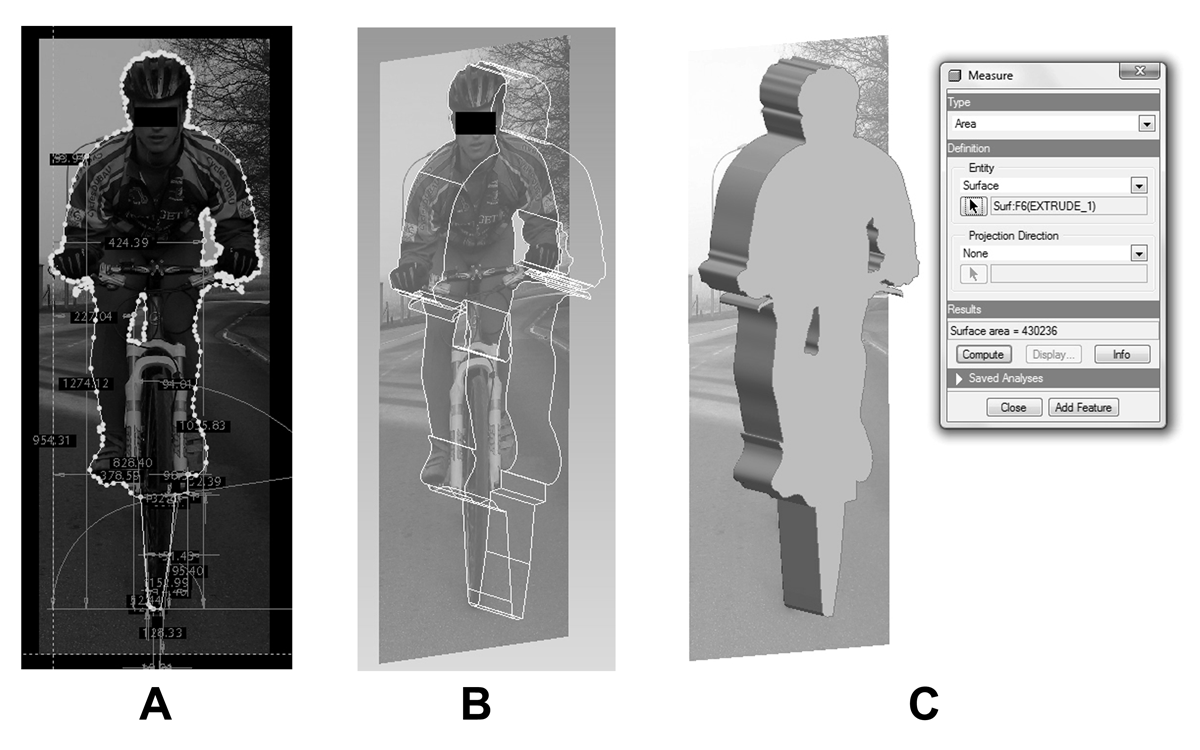
Figure 4. Illustration of the new method using...(Click on the picture to increase it)
To test the reproducibility of the method of weighing photographs and the new method using C.A.D., 30 consecutive measurements were made. That is, 30 photographs of the same subject have been developed, cut and weighed. And 30 clipping was done on C.A.D. software.
The new method was compared with the other two methods to determine if there was a significant difference in the measurements.
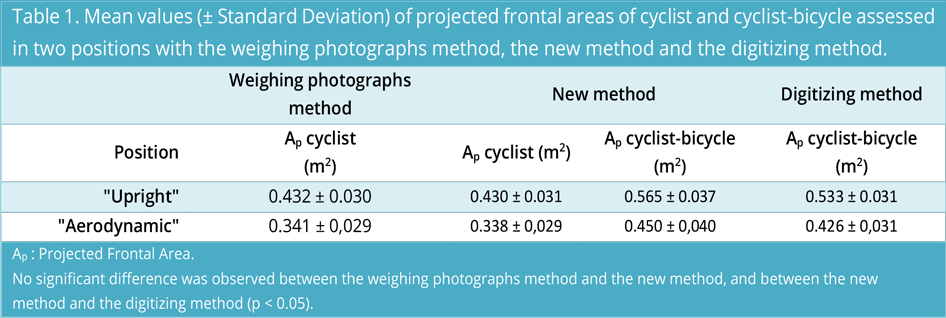
The projected frontal areas determined using the 3 methods are shown in Table 1. Statistical analyzes showed that there was no significant difference between the different methods. In addition, the reproducibility test of the weighing photographs method and the new method showed that both methods had a very small variation: 0.1% for the new method and 1.26% for the weighing. photographs method). These results show that the new method is valid and reproducible for measuring the projected frontal area.
The main advantage of the new method is that it does not require a calibration zone to be placed next to the cyclist, and that it can therefore be used in the field. It will simply be necessary to know a horizontal measurement (e.g., the width of the handlebars) or a vertical distance (e.g., the height of the wheel). Another advantage is the possibility of measuring the projected frontal area of the cyclist alone or of the cyclist and his bicycle. Nevertheless, this method requires the use of a computer and C.A.D. software.
The digitization method also requires a computer but the software is free and downloadable on the net. This method still requires image processing before you can perform a measurement.
The method of weighing photographs does not require a computer but it is necessary to print the photographs and to have a scale sufficiently sensitive (± 0.001 g) to weigh small pieces of paper which weigh less than 0.05 to less than 0.2 grams. However, we found that although the method appeared to be rudimentary, it provided measurements comparable to those obtained using modern digital methods.
The projected frontal area is easy to estimate and gives the coach or cyclist a comparison between different positions. Obviously a position with a low Ap is only one of the parameters which makes it possible to decrease the aerodynamic resistance. In addition, it is necessary to consider, the comfort of the position, and its influence on the pedaling and the power production.
All methods for estimating the projected frontal area have in common the taking of a photograph. This is the determining step to ensure a correct evaluation of the Ap. Here are 3 important points to respect when taking photography. These points are detailed in the review of the different methods of assessment of aerodynamic drag in cycling :
We remind you that you can quote articles by limiting your quotation to 200 words maximum and you must include a nominative link to this one. Any other use, especially copying in full on forum, website or any other content, is strictly prohibited. In doubt, contact us.
Copyright © 2011-2024 - www.sci-sport.com - All rights reserved

 Facebook
 Instagram
 Twitter
 Flux RSS
 Newsletter
 YouTube